|
_ _ _ _ _ _ _ _ _ _ _ _ _ _ _ _ _ _ _ __ _ __ _ _ _ _ _ _ _ __ __ _ _ _ _ __ _ _ _ _ _ _ _ _ _ _ _ _ _ _ _ _ _ _ _ _ _ _ _ _ _ _ __ _ __ _ _ _ _ _ _ _ __ __ _ _ _ _ __ _ _ _ _ _ _ _ _ _ _ _ _ _ _ _ _ _ _ _ _ _ _ _ _ _ _ __ _ __ _ _ _ _ _ _ _ __ __ _ _ _ _ __ _ _ _ _ _ _ _ _ _ _ _ _ _ _ _ _ _ _ _ _ _ _ _ _ _ _ __ _ __ _ _ _ _ _ _ _ __ __ _ _ _ _ __ _ _ _ _ _ _ _ _ _ _ _ _ _ _ _ _ _ _ _ _ _ _ _ _ _ _ __ _ __ _ _ _ _ _ _ _ __ __ _ _ _ _ __ _ _ _ _ _ _ _ |
|
What if machines can see music….? visualization of machines with imagination |
|
If AI can see music, how would it be look like? Machines can learn human behaviors and contents. With Strong AI, machines can recognize images, voices, text, sound etc. But, as we all know, machine interpretation is different from human understanding. Especially in music, human understand and express music in abstract ways, but machines understand music in more analytic and data driven ways. Moreover, with AI, machines can understand music on higher level, which means beyond time dimension. We listen music as time series, but machines can analysis and re-organized it upon its sonic feature distinction. Therefore, my question is, what would music look like with machine’ perspective? This project, “What if machines can see music…?” visualizes similarities and relationships of many audio chunks from a single audio track. From this visualization, we can see how many audio events happened in one audio file ( via number of chunks) and how those chunks are related to each other (via clustering). And also, you can listen those chunks as time series. Every audio file has different sonic events and feature distinctions. Therefore, with this visualization, each music file can have its own from and figure. Can machines be creative? Yes, I guess. because machines can see the world not like human does and never like human can image. This is machine singularity which human doesn’t have. This project has been selected NIPS Machine Learing for Creativity Workshop exhibition, 2017. For the exhibition, click *HERE* [data] 1. As input, a single audio track (a song) into many audio chunks. 2. Those chunks happened according to the beginning of discrete sonic events in the input audio. 3. With librosa lib( mel-spectrogram), features are extracted from those audio chunks. 4. as result, 26 features from each chunk. 5. clustering those chunks via t-sne according to feature similarities TEST_classical music. audio source : “Only” by Alex Mason and The Minor Emotion audio link : freemusicarchive.org According to mel-spectrum analysis, one audio file can be chunked in many smalls according to its sonic events. 
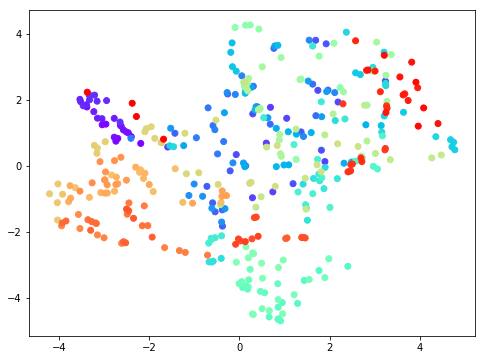
With t-sne algorithm, those chunks are clustered according to its feature similarities. Colors are applied to first chunk to the last, from red to purple. (rainbow color). From this 2D visualization, we can recognize intro part(red group) and ending part (purple group) are distinguishable from the rest. 
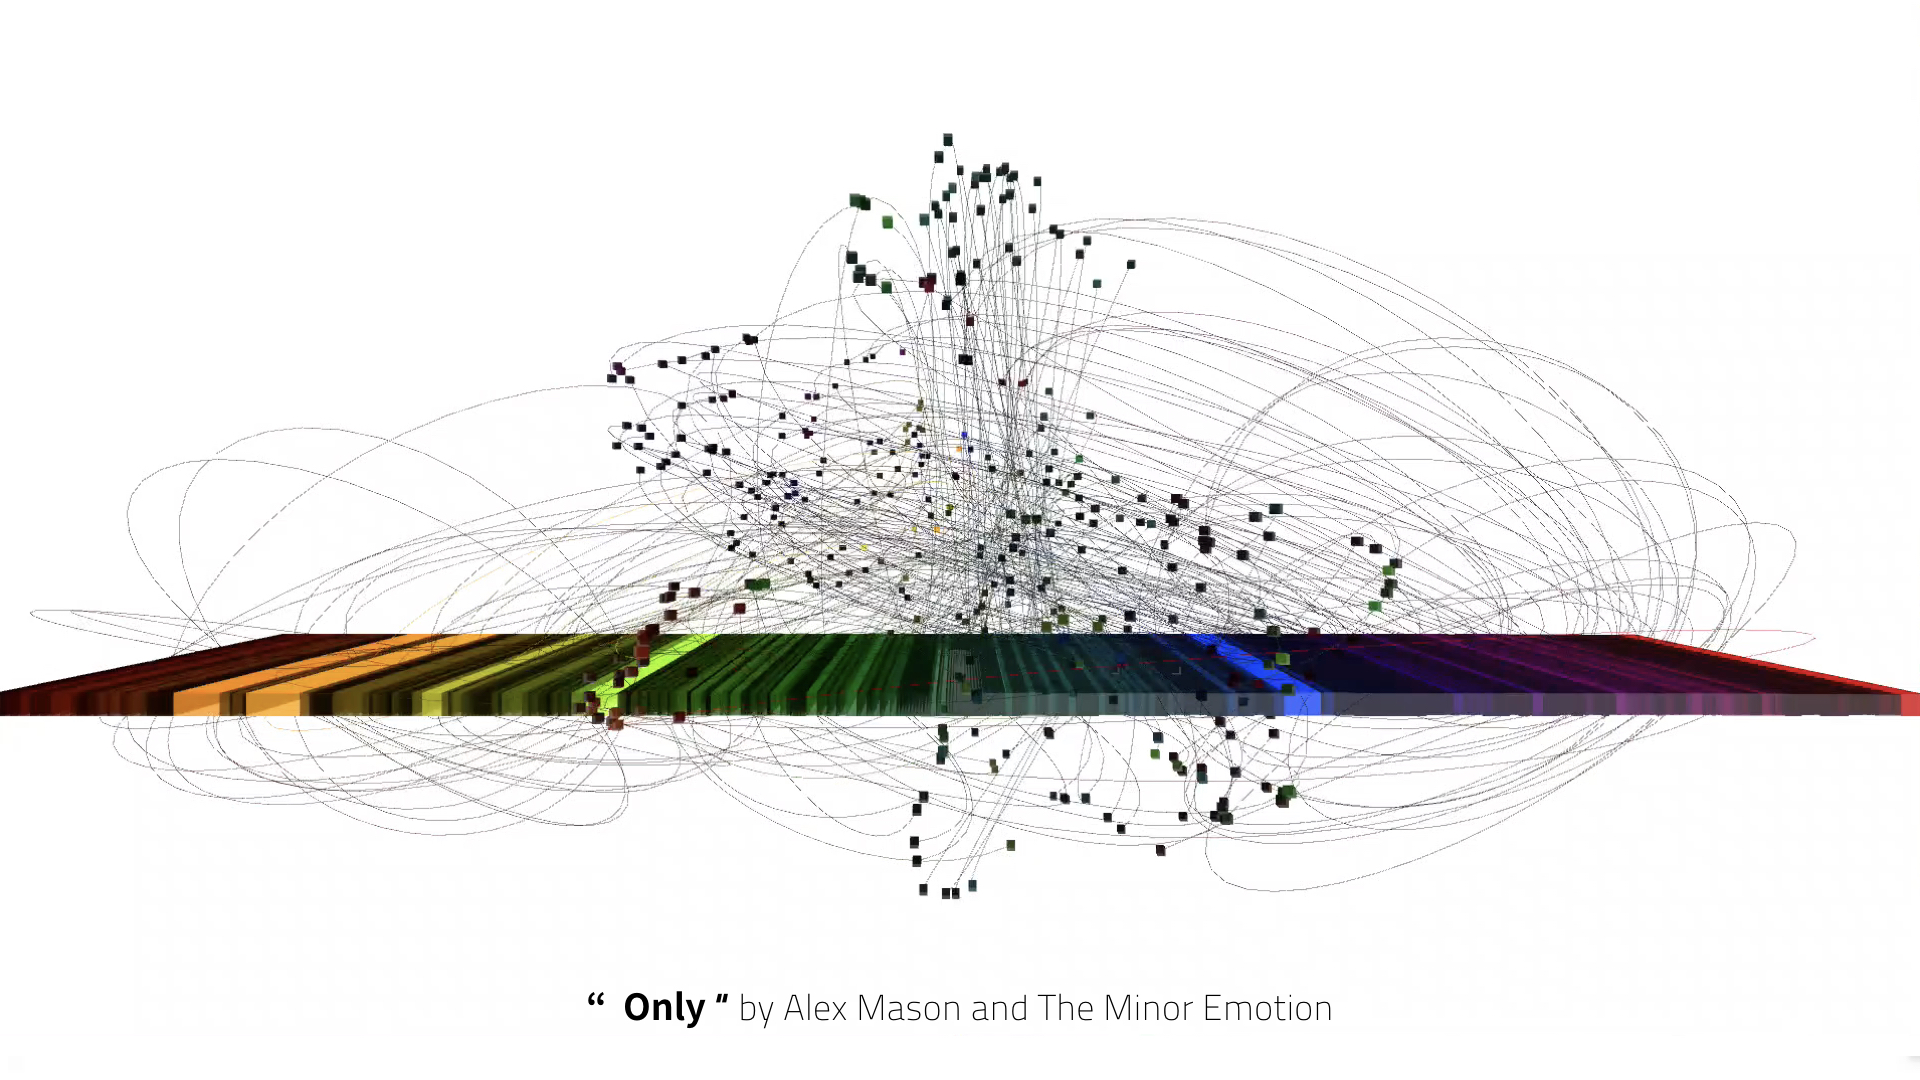
-2D clustering video [visualization] 1. Visualizing high dimensional data in low dimensional space. 26 features of audio chunks in 3D space with t-sne. 2. Two tracks of visualization 2-1) first track : as time order, all the chunks are shown at the bottom. The size of each box represents the length of the audio chunk. 2-2) second track : place the audio chunks in 3D space according to its feature similarities with other chunks. 3. Sound : play each chunks according to its time order. 4. As result, every audio file can have its own form and shape. 
- more tests - After testing a classical music, I have expanded my exepriment to more various genres such as electronic, contemporary, of course pop music. TEST_ electronic music audio source : “CosmoF” by sanmi audio link : freemusicarchive.org Mel-spectrum analysis. 
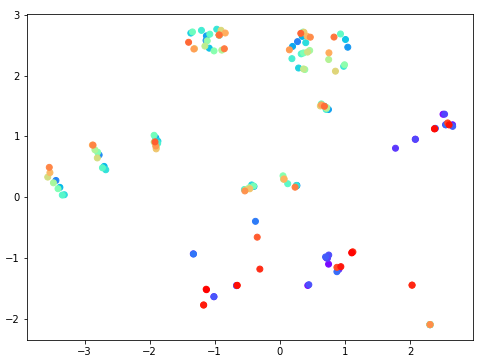
Clustering with T-SNE 
2D clustering video |